Saturday, December 21, 2019

What is the most easiest way to understand the interaction of subatomic particles?

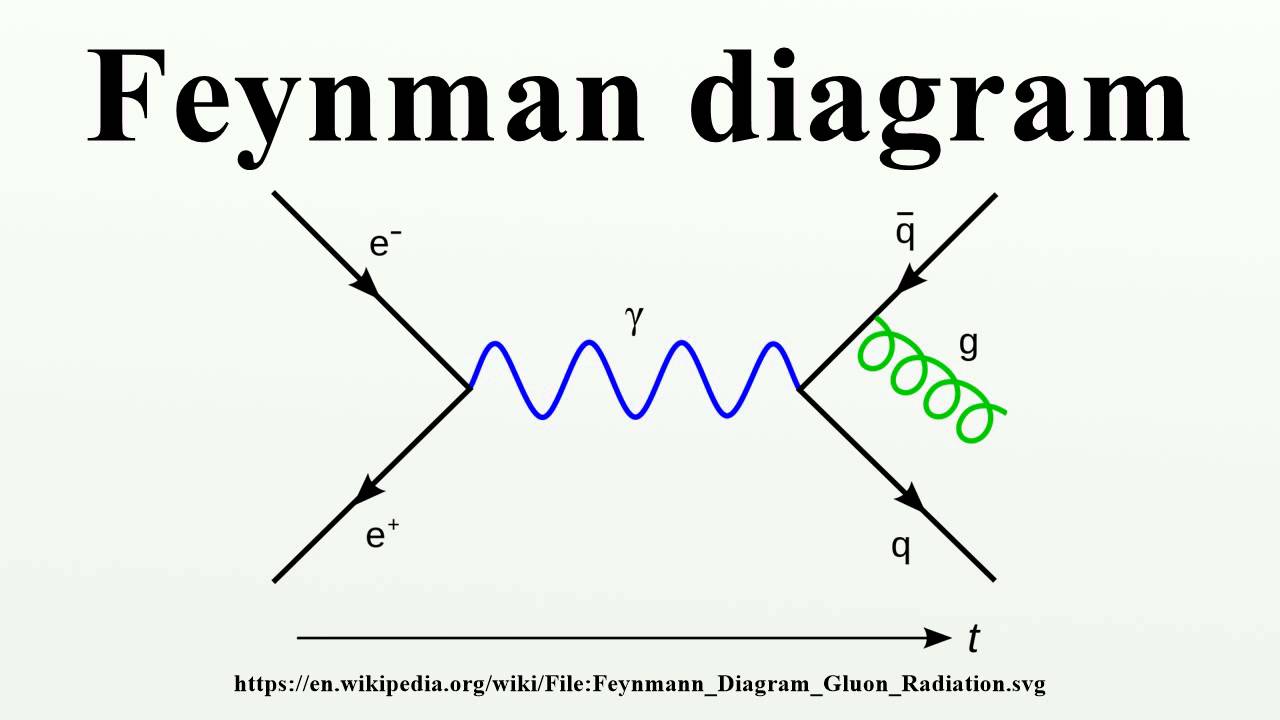
The easiest way to represent and understand the interaction of subatomic particles is by using Feynman Diagrams.


Image result for feynman diagram


In theoretical physics, this method is used as a pictorial representation of the mathematical expressions of the behaviour of subatomic particles. This method was given by one of the famous scientist and lecturer Richard Phillips Feynman.

 Image result for feynman


These diagrams are used to calculate the most difficult equations using diagrams.
For example collision of two electrons: When two electrons collide they interact with each other and scatter apart. The interaction happens as follows:
When two electrons are brought together they repel each other and move apart. This repulsion takes place due to the exchange of the gauge bosons. Gauge boson exchange is otherwise known as the exchange of particle or information. These are virtual particles.
Here photons are the exchange particle involved.
The photon released from one particle hits another electron and changes its path.

Thus represented by the given diagram below:

Image result for feynman diagram illustrating collision of two electrons


Rules to draw Feynman diagram are:
1. Time is always pointed upwards.
2. Space is on the x-axis moving forward towards the right.
3. Always start the incoming subatomic from down
4. The interaction or the process is represented in between
5. And the outgoing subatomic particles are represented at the top 


The below figure illustrates the representation used to represent different particles involved:


Related image


The diagrams can be more complicated for the above-given example if we consider the emission of photons before or after the process or else emission and reabsorption of photons before or after the process.
Image result for feynman diagram


There can be a particle and antiparticle formation during the exchange of photons.

Related image


These diagrams are used to find more accurate equations for the phenomena occurred.
Each time a photon interacts with a charged particle the chance of the phenomena to happen is less likely. Single emission of photon drops to 1% of 1% i.e, 0.01%.


For more detailed understanding from the basic level of  particles involved in the standard model we take the example of :


Image result for feynman diagram illustrating collision of two electrons


With the emission of a W boson, the quarks change their behaviour and form a different subatomic particle.


The interaction of particles is a very interesting and vast topic.

For further understanding visit:

https://arxiv.org/pdf/1602.04182.pdf

https://simple.wikipedia.org/wiki/Feynman_diagram


Physics has a history of synthesizing many phenomena into a few theories. 

-Richard P. Feynman


Tuesday, December 3, 2019

The theory which is loved by every scientist around - THE PERTURBATION THEORY

Image result for paul dirac


Yes, this theory is opted by almost all the scientist and observers of different disciplines especially the domains which cannot give well-defined experimental results. This approach was given by Paul Dirac in 1927. It was later named as the Fermi's golden rule.

Perturbation Theory is a mathematical analysis to find an estimated solution from the exact solution to the similar and simplest problem.


THE BASIC IDEA BEHIND THE PERTURBATION THEORY

This simple example can cheer you up:
Image result for making tea
While making the tea we don't take a weighing machine to calculate the amount of tea powder to add to the milk boiling. We just take an approximate amount which we feel perfect.
This happens in science too !!!


As to understand this amazing approach in a more comprehensive mode we have to know a little mathematics.

The sine series 

Image result for sine series
This is the graph of a sine function.
The series equation is 

Image result for sine series  
Here we take the expansion of sine series.
For a given value of x and computing it in x or in x - (x^3)/3! we can get a fair answer.
This is how the perturbation theory works.


For more transparency, we take the example of the shape of the earth.
We are taught in our schools that the shape of the earth is spherical with a radius of 6400km
Image result for the shape of the earth

 But it is not exactly spherical if we consider all the factors into account.

The rotation of the earth around its axis influences the distance from the poles and the distances from the equator from its centre.

Image result for the shape of the earth

The distances from the poles and equator to the centre of the earth turns out to be 6357kms and 6378kms respectively. The diameter is of the Earth is 42kms fatter than it is tall. The difference is only about 0.3% or 1/300th part.

Recognizing the Antarctic ice sheet squishing the bottom of the Earth and other effects the North pole bulges upwards about 17mts and makes a bulge of 7mts in mid-southern latitudes.

Related image


This method has given countless unsolvable enigmas with satisfactory answers and is still being used by everyone around the world.


Hope it was helpful!
For queries comment in the comment section below.


“LEARNING IS NOT ATTAINED BY CHANCE, IT MUST BE SOUGHT FOR WITH ARDOR AND ATTENDED TO WITH DILIGENCE.” ―ABIGAIL ADAMS